Cloud Efficiency Reports
The Cost Report
The cost report provides detailed insights into how each business application contributes to the overall cloud bill, covering all cloud accounts and clusters. It also shows how these costs are distributed among the various teams and divisions within the organization.
Within this report, users can get a comprehensive understanding of:
- Current and historical cloud spend
- Realized savings (achieved by Torque)
- Potential savings and and strategies to achieve them
This report empowers users to answer key questions such as:
- How is each cloud account contributing to the total bill ?
- How is the total bill divided between the different spaces, blueprints and users?
- Are there users who spend significantly more then their colleagues?
- What are the most expensive environments?
- What are the most expensive blueprints?
Let's look at an example:
Checking the Cost by Spaces chart, we can see that the red space spend has significantly increased in the last couple of days:
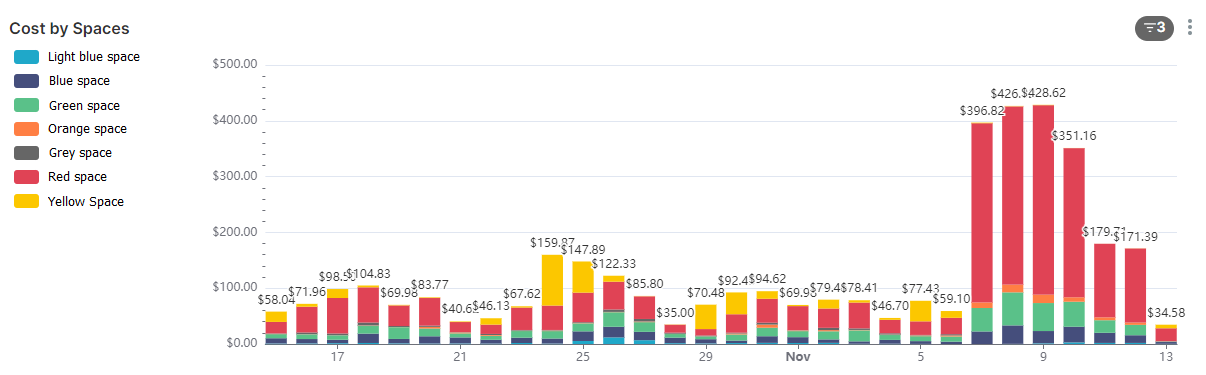
We can now cross-filter by this space to understand what's causing this and if this is expected or not.
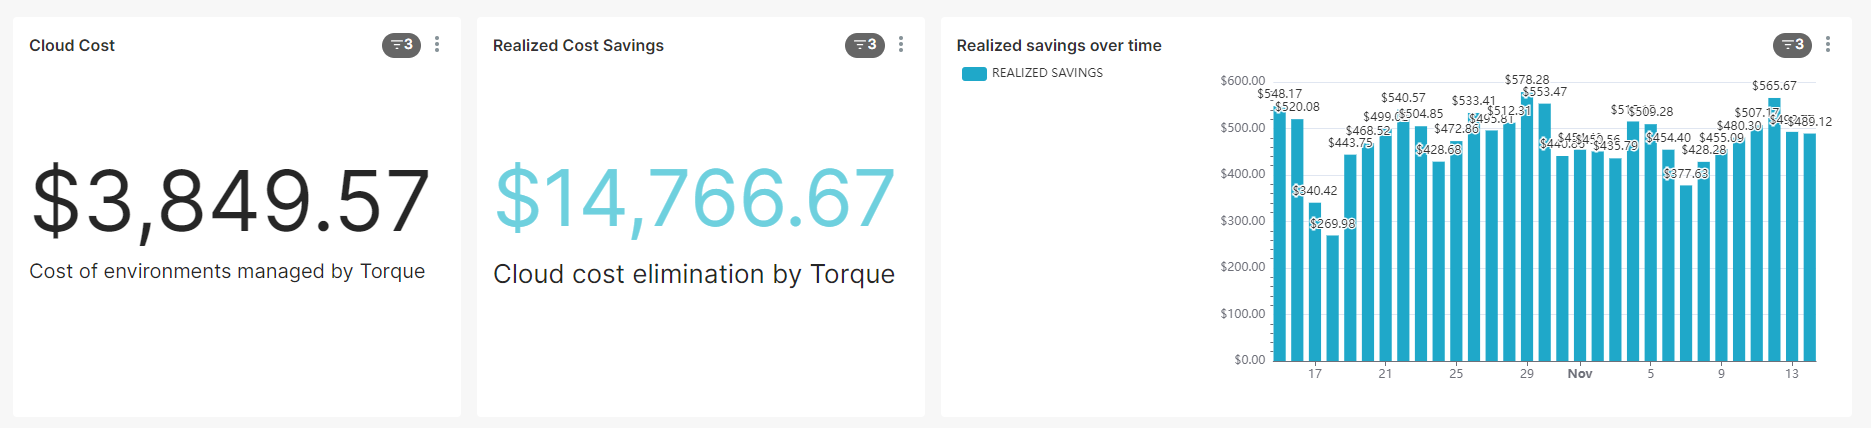
The Realized Savings Report
The Realized Savings Report provides a comprehensive overview of the cost savings achieved through the use of Torque. By employing Torque's Workflows after the deployment of environments, users can efficiently (manually or automatically) start and stop cloud resources within an environment when they are not in use. When resources are stopped, users avoid incurring costs, resulting in tangible savings on cloud expenses.
Torque actively monitors the status of resources in each environment, distinguishing between running and stopped states. The occurrences where resources are stopped, facilitated by Torque actions, contribute to the realized savings. The report offers a macroscopic view of overall savings, allowing users to comprehend the impact of their actions and workflows.
Users can zoom in on specific environments to gain a detailed understanding of their savings patterns:
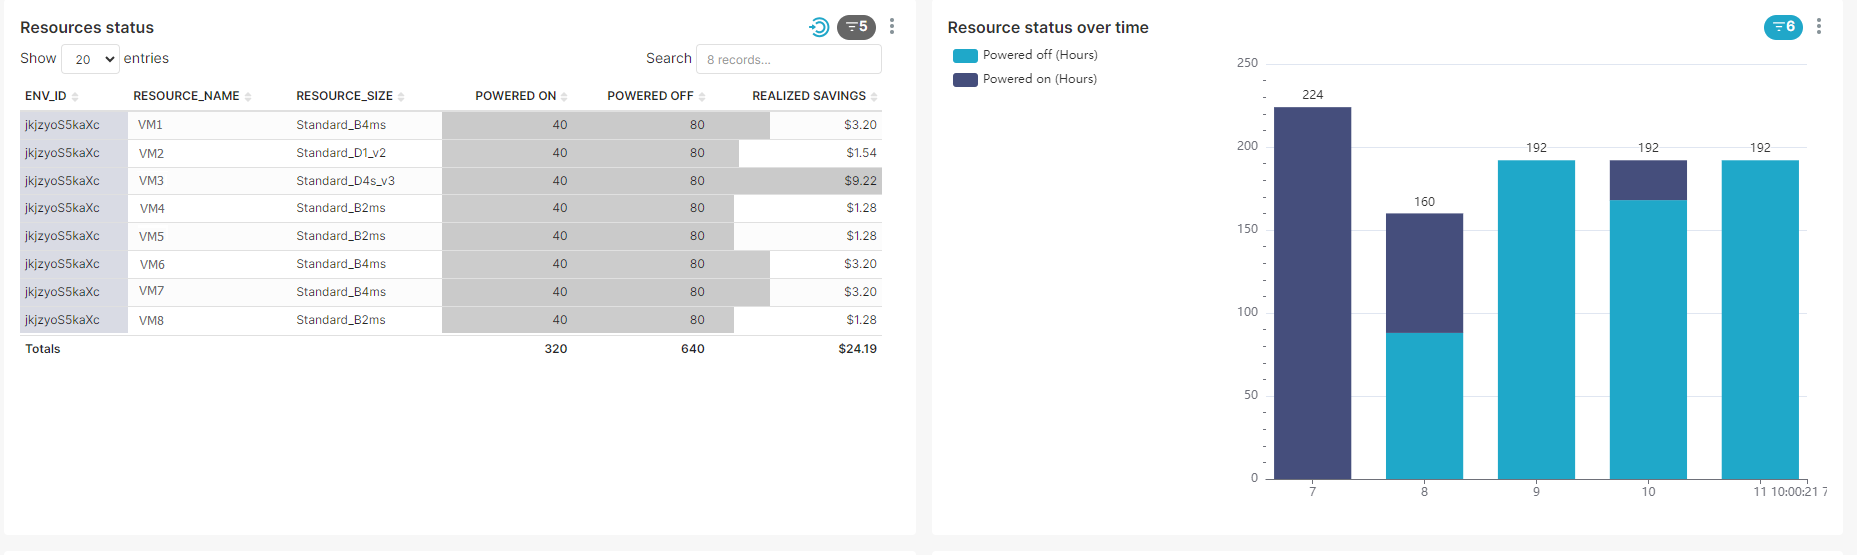
In the provided example, an environment comprising 8 virtual machines exhibited intermittent power states over the past week, predominantly in a powered-off state, with one day of continuous operation. By accessing the environment, users can inspect workflows and actions to assess whether this behavior aligns with expectations or if optimization opportunities exist.
Moreover, users can delve into specific resources to examine their individual behaviors and contribute to a more granular analysis.
Understanding the Calculation of Realized Savings
Taking a closer look in the above example, we can understand how the realized savings are calculated. Each resource has the following information attached to it:
- The resource type or size
- The total time across the analyzed period in which the resource was running
- The total time across the analyzed period in which the resource was stopped
If we look at the first resource - its type is "Standard_B4ms". Querying Azure, the hourly price for this type of VM is 0.05$/hour. Multiplying the hourly cost with the number of "off" hours yields:
0.05*80 = 4$
To make the calculation more realistic, Torque then reduces 20% of the cost:
4*0.8 = 3.2$
Hence the savings for this resource is 3.20$ for the analyzed period of time.
The Potential Savings Report
Detecting inactivity of cloud resources is a crucial aspect of optimizing cost and resource utilization within cloud environments. Torque leverages advanced machine learning techniques as part of its monitoring mechanisms to accurately identify periods when cloud resources remain inactive or underutilized.
This intelligent analysis reveals to users the specific timeframes during which they can take actions or create workflows to automatically stop or scale down resources. This proactive approach, guided by machine learning insights, enables users to minimize unnecessary costs associated with idle cloud resources.
Transforming Potential Savings Into Realized Savings
Idle resources over time chart
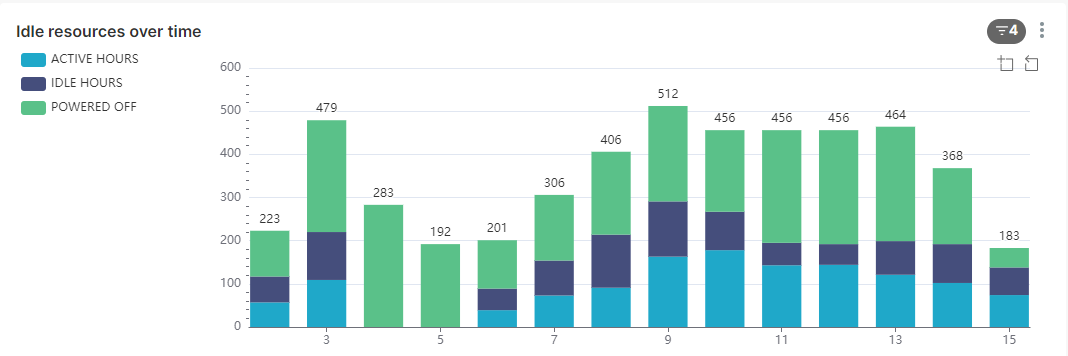
Examining the Idle resources over time chart provides a high-level perspective on potential savings. In the given example, the overall status appears robust, with approximately 50% of the time showing powered-off VMs. However, there's still room for additional savings, as indicated by the dark blue sections of the bars.
Resources waste chart
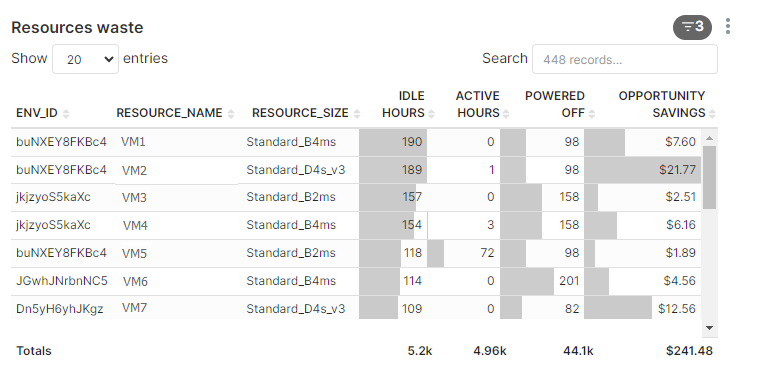
Moving to the Resources waste chart allows for the identification of optimization opportunities.
In the provided example, several areas for improvement are observable. A few examples:
- VM1 remained idle for 190 hours, powered off for 98 hours, and was never used by environment users.
- VM2 was active for only 1 hour.
- VM3 was idle for 157 hours.
To optimize these scenarios:
- Assess whether VM1 is necessary in every environment. If it's only required in certain environments with the same blueprint, consider creating a blueprint without this resource. Launch environments not needing VM1 from the new blueprint, eliminating the cost of VM1 in those instances.
- Initialize VM2 to be turned off, manually activating it only when necessary, and promptly turning it off afterward.
- Investigate the idle time of VM3. Does it align with off-hours or weekends? Configure a workflow to automatically power off VM3 during non-operational periods.
Understanding the Calculation of Potential Savings
The computation of potential savings closely mirrors that of realized savings. For each resource, considerations include:
- The resource type or size
- The total idle time during the analyzed period
The potential savings for a resource are then determined by multiplying the hourly cost (retrieved from the cloud provider) by the number of idle hours. This calculation provides the potential savings attributed to each specific resource.