Audit Log Configuration
Prerequisites
- An active, internet-connected Elastic Stack or OpenSearch server
Configuration
-
Navigate to Configuration > Audit Log, and click Add Audit Target.
-
Select one of the following target options:
- Torque Audit: Forwards logs directly to Torque with a retention period of 18 months
- ElasticSearch / OpenSearch: Uses built-in integrations to forward audit data for real-time analysis, visualization, and reporting
-
If selecting ElasticSearch or OpenSearch, configure the following parameters:
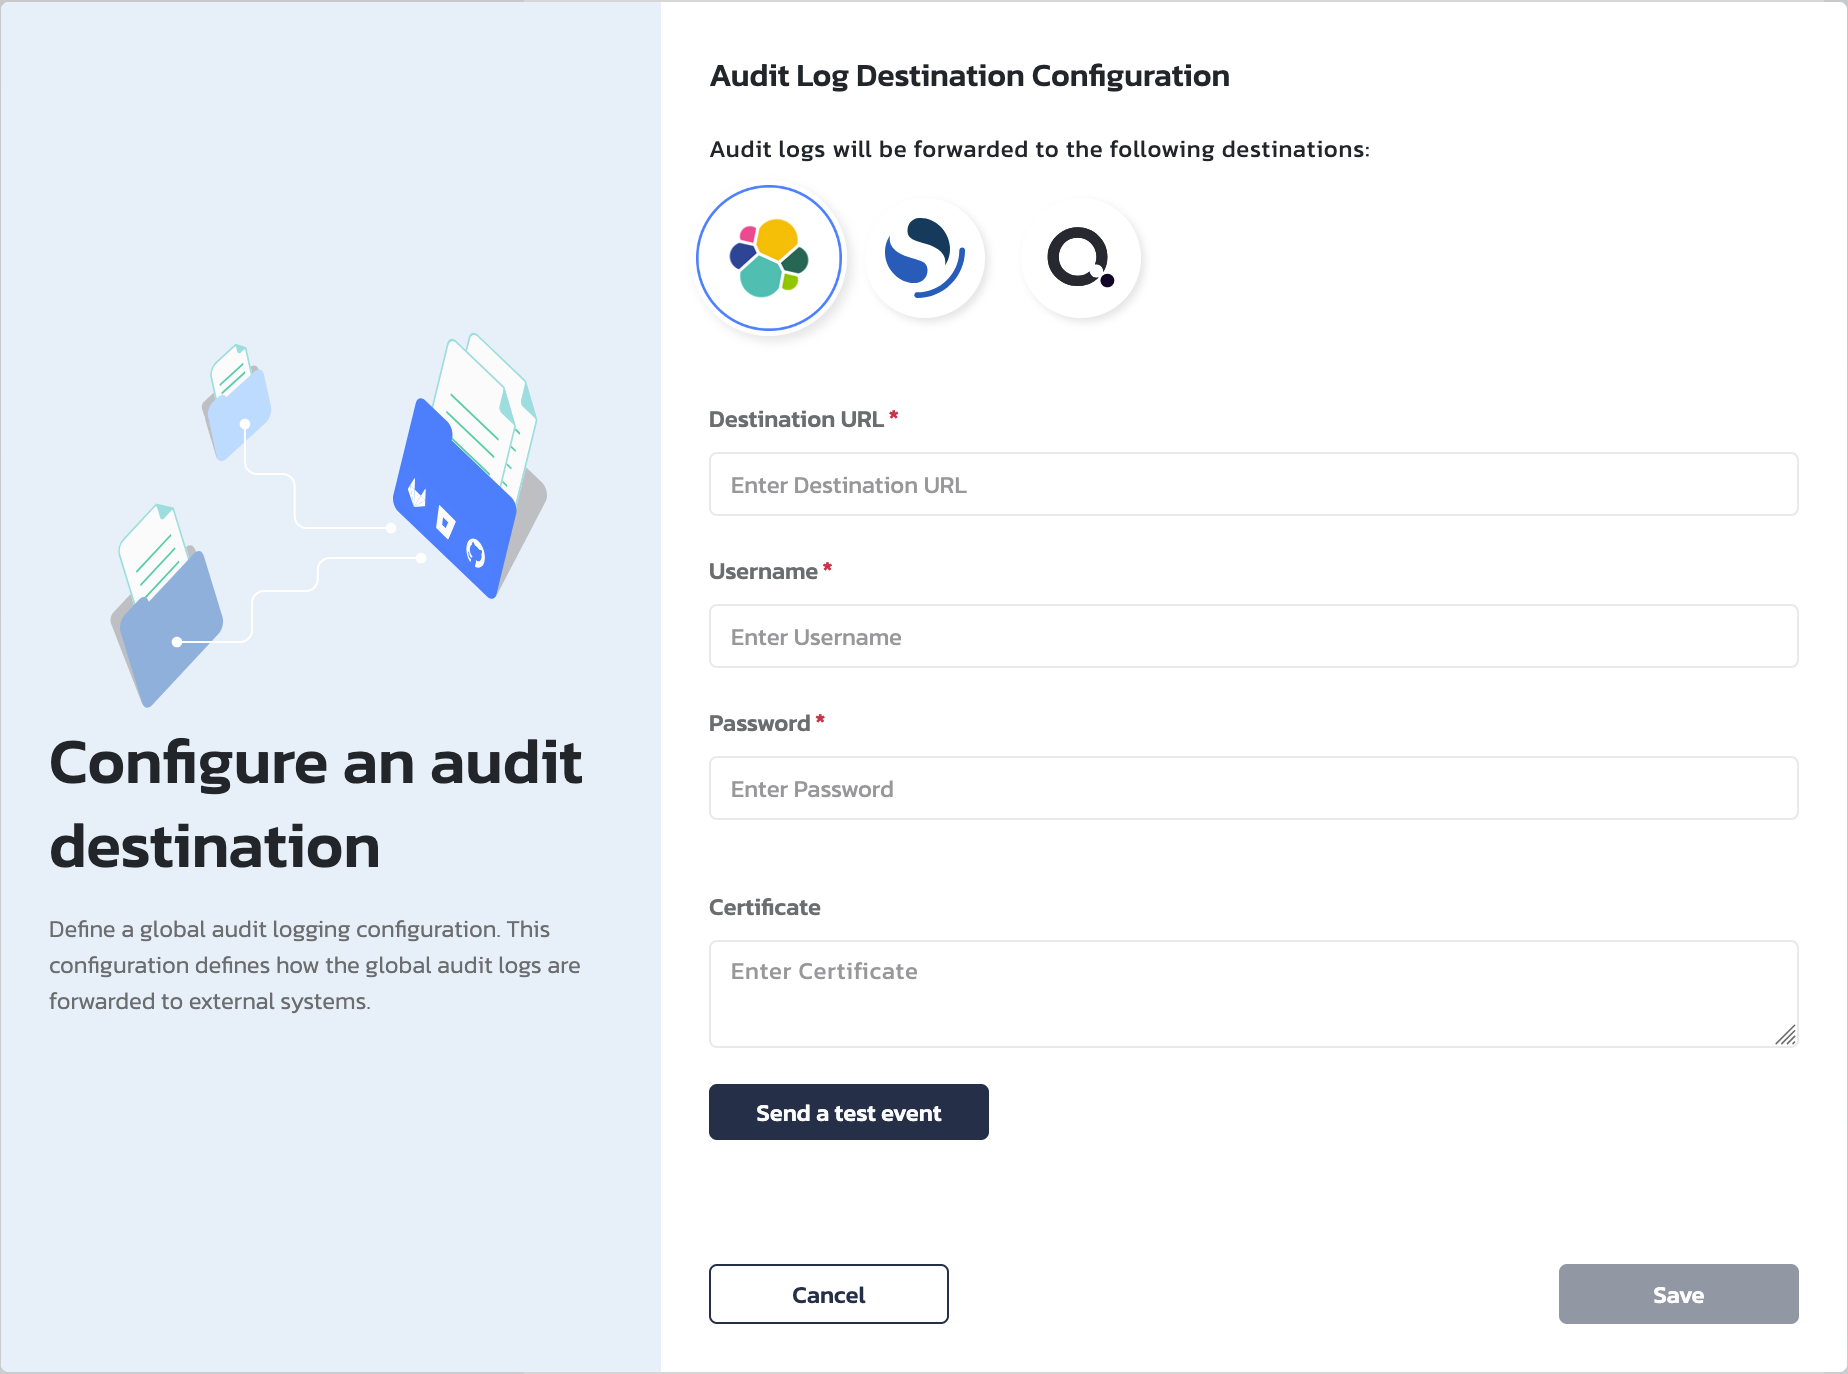
- Destination URL: The endpoint URL of your ElasticSearch or OpenSearch
- Username/Password: Administrative credentials for authentication
- Certificate: (Optional) Provide the HTTP CA certificate to secure the connection via SSL/TLS
-
Click Send a test event to verify connectivity, then click Save.
-
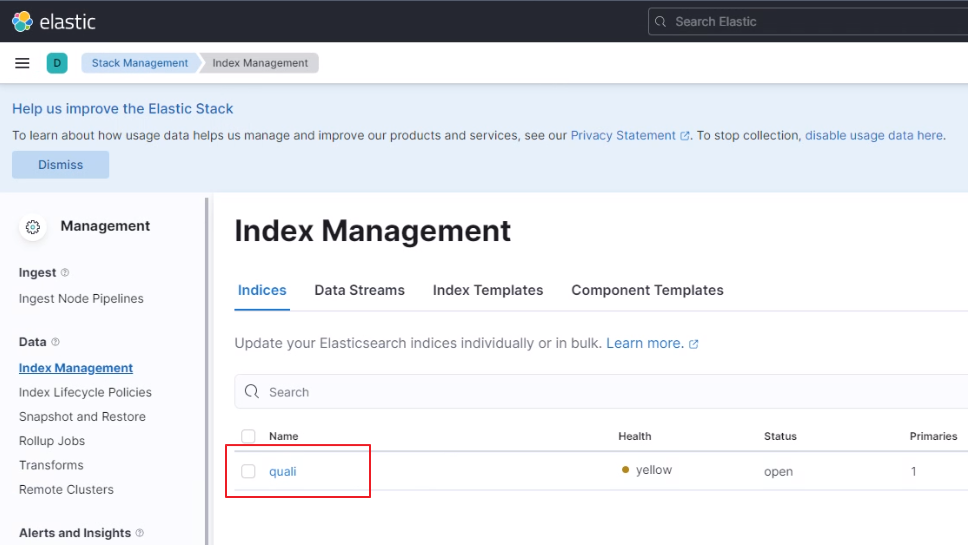
Log in to Kibana or OpenSearch Dashboards, navigate to Management > Stack Management > Index Management, and verify that the quali index is present.
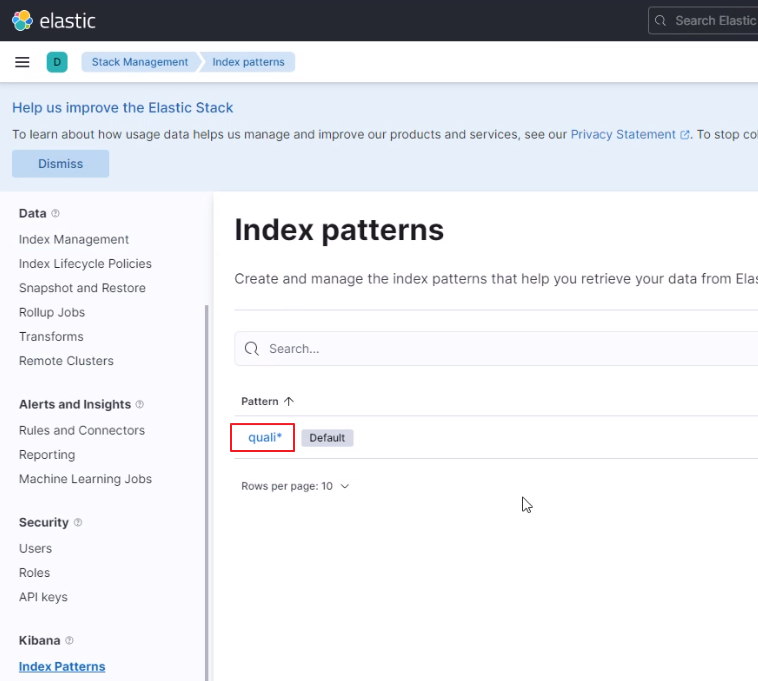
- Proceed to Index Patterns (or Data Views / Index Management depending on your platform version) and create a
qualiindex pattern to expose the data.
Audit log configuration is complete, and Torque events are now being successfully ingested.